


NVT Long Term Yield Reports app for iPhone and iPad
Developer: National Variety Trials
First release : 22 Feb 2017
App size: 0 Bytes
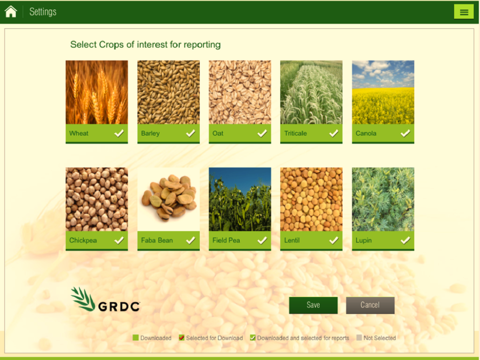
The NVT Long Term Yield Reports provide Australian growers and advisors with the best available tool for making variety selection decisions based on crop yield. Information is available for all cropping regions in Australia for ten crops including wheat, barley, canola, oat, triticale, chickpea, field pea, faba bean, lentil and lupin.
To generate the data, a multi-environment trial (MET) analysis of NVT data is conducted using multiple years of individual trial data. For most crops, a five year period is used, but this can vary up to ten years for barley and down to three for canola (likely case for the 2015 analysis). The most appropriate duration is selected based on correlation between varieties across years.
A factor analytic (FA) approach to the analysis is undertaken using the national dataset for most crops. However, for wheat and barley, the FA method was used on mega-region based datasets, splitting the dataset into agro-ecological regions.
The long-term analysis produces Best Linear Unbiased Predictions (BLUP) values for each variety in each trial using the MET dataset. These values are also referred to as “Production Values” or “PVs” and are the best prediction of a variety’s performance in a particular trial. They are much more reliable than the “single-site” analysis that produces variety predictions using the information from a single trial in a single year.
Once the Production Values have been determined, they can be used as a very powerful tool for predicting yield performance. PVs not only give the best prediction of yield performance at a single trial level, but datasets from across groups of trials, specific regions or different years can be combined to show the most likely variety performance outcomes. This gives great confidence in the dataset and growers and advisors can customise information to suit their specific needs.
Historically, the Long Term Yield analysis combined data from all trials across a region to produce a single yield prediction per variety for that region. This method did not account for seasonal yield variation, such as the affect of a dry spring or a late autumn break. Years where faster maturing varieties yielded well were combined with years where longer season varieties yielded well, and the end results didn’t separate, identify or account for this variation.
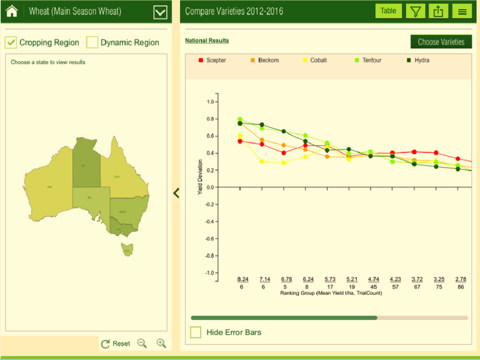
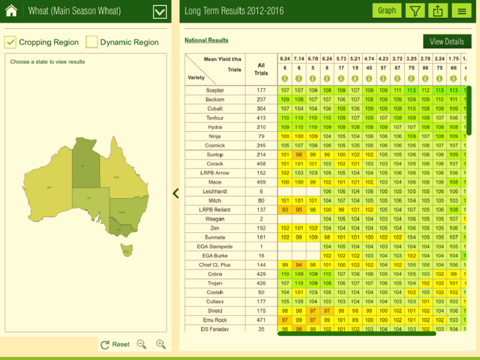
Now, the Production Value system uses the complex MET analysis to provide the most accurate prediction of variety performance down to the individual trial level. The downside to this level of accuracy is that the wheat dataset, for example, can have over 11,000 rows of data for users interpret. This application helps users interpret the data by grouping trials together with similar mean yields. Data is presented at 0.5 tonnes/ha yield groupings and predictions are averaged across the group of trials selected. This might be national (not recommended), state or region based, dynamically selected across different sites, or at the individual site level.
The data can be viewed in the default tabular format or in a line graph where trends and patterns of specific varieties can be compared. The datasets also provide the number of trial that each variety has been tested in, and the number of trial constituting each yield group providing users with a data reliability index. A higher number of trials ensures more confidence in the data.
The NVT Long Term Yield Reports App – Providing users with leading edge variety performance data in an easily interpretable format. The data is generated through the GRDC funded National Variety Trials program.